📘 Glossary of Key Trading Terms — A Quick Reference for Every Trader
Whether you’re just getting started or refining your edge, understanding these core concepts is essential to navigating the markets. Save this post for future reference, or share it with someone diving into the trading world.👇
📊 Core Market Terms
🔹 Account Equity – Total value of your trading account (cash + open positions). 🔹 Ask Price – The price sellers are willing to accept (you buy at the ask). 🔹 Bid Price – The price buyers are willing to pay (you sell at the bid). 🔹 Spread – The difference between the bid and ask price. 🔹 Slippage – When a trade executes at a different price than expected.
📈 Price Movement & Charting
🔹 Bar Graph – Shows high, low, open, and close for some time. 🔹 Candlestick – A visual chart format showing open, high, low, and close—with colours for price direction. 🔹 Chart Pattern – Price formations like triangles or cup-and-handle, used for forecasting. 🔹 Breakout – Price moving beyond a defined level or range. 🔹 Consolidation – Sideways movement following a trend, often a pause before the next move. 🔹 Price Action – The raw movement of price over time.
📉 Trend Terms
🔹 Bullish – Expectation of rising prices. 🔹 Bearish – Expectation of falling prices. 🔹 Trend – The overall direction (uptrend, downtrend, or sideways). 🔹 Uptrend – A series of higher highs and higher lows. 🔹 Downtrend – A series of lower highs and lower lows. 🔹 Support – A price level where buying typically comes in. 🔹 Resistance – A price level where selling tends to emerge.
⚙️ Technical Tools & Indicators
🔹 Fibonacci Retracement – A tool to find potential reversal levels based on Fibonacci ratios. 🔹 Oscillator – An indicator that swings between limits to show overbought/oversold levels. 🔹 Volume – The number of units (shares/contracts) traded. 🔹 Open Interest – Number of active (unsettled) futures or options contracts. 🔹 Tick / Point / Pip – Units to measure price movement. Pips are used in forex, ticks, and points in other markets.
💼 Strategy & Risk Management
🔹 Leverage – Borrowed funds used to amplify position size—powerful but risky. 🔹 Margin – Your capital required to open/maintain a leveraged trade. 🔹 Stop Loss Order – A predefined exit to cap losses on a trade. 🔹 Risk Management – A framework to limit losses and protect capital. 🔹 Trading Plan – Your written strategy with entry/exit rules and risk guidelines. 🔹 Triple Screen Trading System – Elder’s strategy using three timeframes to validate trades.
🪙 Cryptocurrency-Specific
🔹 Stablecoin – A crypto asset pegged to a stable value like fiat or commodities.
📌 There’s much to absorb in trading, but clarity begins with language. The more precise your understanding, the better your decisions.
📘 FAQ: 10 Trading Concepts Every Serious Trader Should Understand
Whether you’re new to trading or refining your edge, mastering the foundational concepts matters. This FAQ draws on Alexander Elder’s work to help you build stronger habits, reduce emotional trading, and improve performance over time.
1. What does Alexander Elder believe is more important than making money in trading—and why?
Honing your skills and striving to reach your best. According to Elder, when traders focus on trading correctly and improving consistently, money follows as a natural result—not the primary goal.
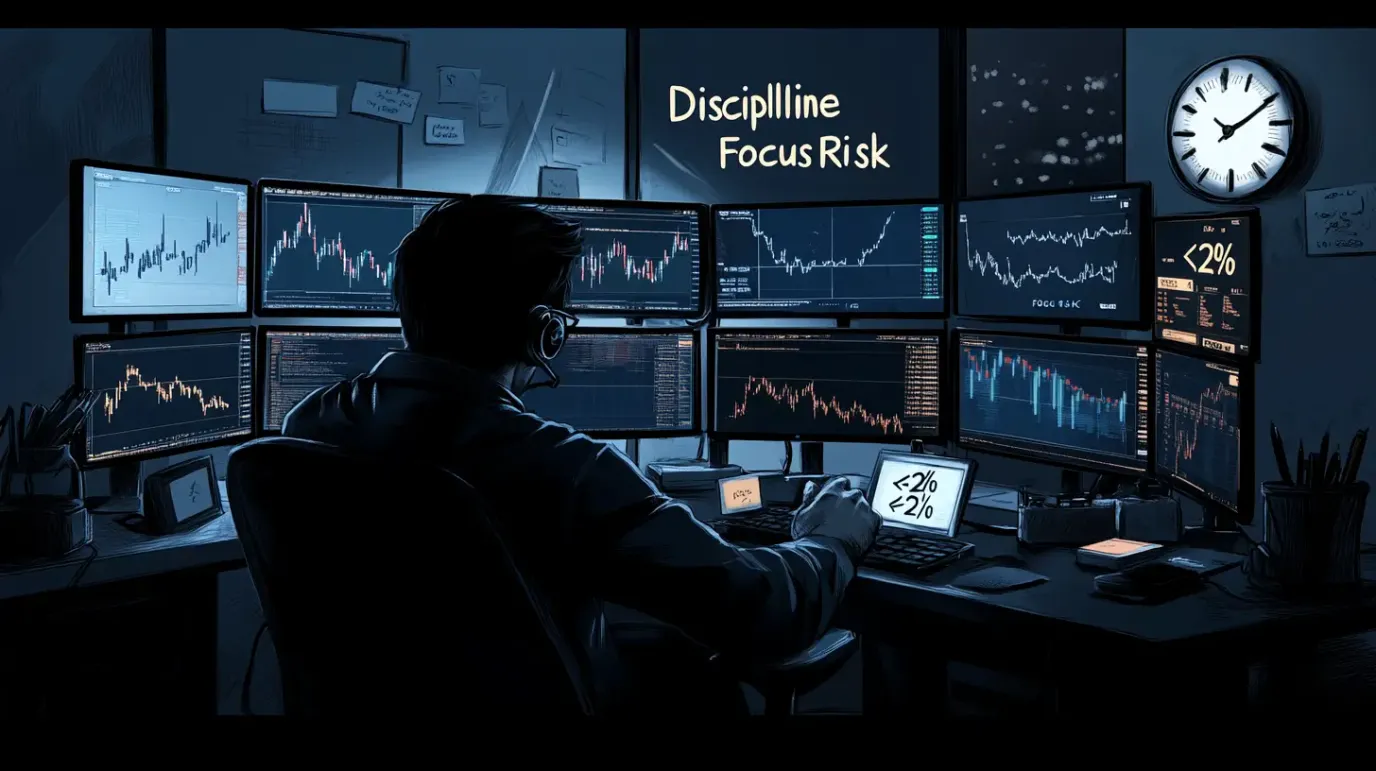
2. What is “businessman’s risk”, and how does it work in practice?
A businessman’s risk is the maximum amount a trader should risk on any single trade. Elder recommends limiting risk to no more than 2% of your account equity. Example: With a $10,000 account, your maximum risk per trade would be $200.
3. What are the three pillars of successful trading according to Elder?
- Market Analysis – Understanding the ongoing battle between bulls and bears
- Money Management – Defining risk, position size, and capital preservation
- Emotional Discipline – Consistently following your plan and managing emotions
4. What’s the difference between support and resistance—and why do these levels form?
- Support is a price level where buying pressure is strong enough to halt a decline.
- Resistance is where selling pressure prevents further price increases.
These levels often form because of trader memory — market participants recall key levels from the past and respond accordingly when price returns to them.
5. How can volume confirm a trend or indicate a reversal?
Volume acts as a truth detector for price moves.
- High volume during a breakout or trend continuation confirms conviction.
- Declining volume during an ongoing trend may signal weakness and a coming reversal.
6. What does open interest reveal in futures and options markets?
Open interest is the number of active contracts that have not yet been settled. It reflects market participation:
- Rising open interest = growing commitment from traders
- Falling open interest = weakening conviction or traders closing positions
7. What are the three time frames in Dow Theory—and what’s the analogy?
Dow Theory breaks market trends into three levels:
- Long-term trend – like the tide (years)
- Intermediate trend – like the wave (months)
- Minor trend – like the ripple (days or weeks)
This analogy, popularised by Robert Rhea, reminds traders to respect the larger trend when trading shorter moves.
8. How does Elder’s Triple Screen Trading System work?
The Triple Screen System uses three timeframes for confirmation and timing:
- First screen: Weekly chart – identify the long-term trend
- Second screen: Daily chart – use oscillators to detect counter-trend moves
- Third screen: Intraday chart – find precise entry points in the direction of the long-term trend
9. How does financial stress affect one’s ability to trade effectively?
Financial instability impairs cognitive performance. A study in India showed that farmers’ IQs dropped during times of economic stress. The implication for traders is direct: a calm, stable mental state is a prerequisite for clear decisions, not a luxury.
10. What are the four leading market conditions traders should recognise?
- Bullish – Price is trending upward (bottom left to top right)
- Bearish – Price is trending downward (top left to bottom right)
- Ranging – Price moves sideways without a clear direction
- Choppy/Indecisive – Erratic price behaviour with no strong trend
🧠 Final Thoughts
Trading is as much about psychology and discipline as charts and indicators. Understanding these core principles helps traders stay grounded, avoid emotional decisions, and approach the markets with structure.